Using Zabbix to Monitor Zcash GPU Miners
I really like Zabbix. It’s open source, been around for well over a decade, and does exactly what I need for monitoring my gear. It gives me a dashboard I can check anytime, and sends me an email when there is a problem that I consider important enough to be notified about.
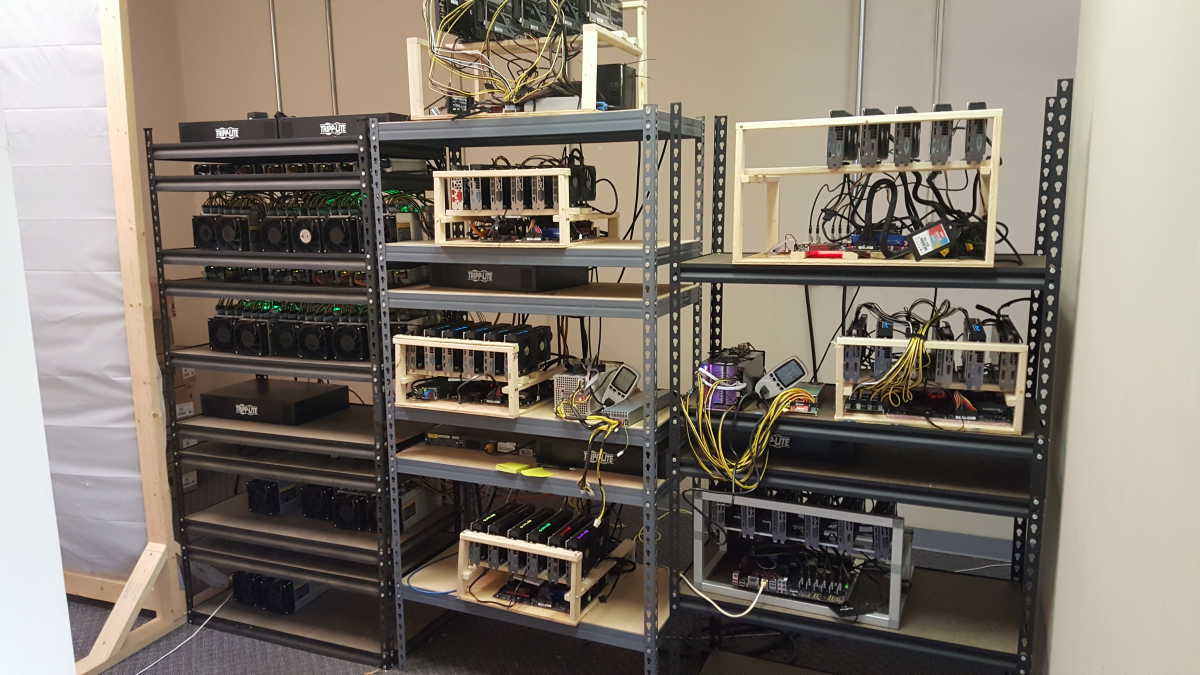
The header picture is of my Block Operations lab. I can monitor my Zcash miners at my lab, the ones running in my office as space heaters, and all the systems at my mining production facility, all on one Zabbix server screen.
Here is a screenshot of what I monitor with Zabbix on my GPU miners running the Optiminer Zcash 1.6.0 application.

I have the main Zabbix application running on a $10/month VPS at Linode, so it’s always available to me. At my mining locations, I use a Raspberry Pi running Raspian as a $60 linux server running the Zabbix proxy application. The Zabbix proxy connects back to the Zabbix server VPS over any available internet connection, so even if my primary internet has failed over to the backup, the Zabbix proxy still connects and uploads data.
For Antminers, I had to create a script that queried the Antminer status with JSON. Any bash script that provides data back to the Zabbix server works, so I was happy with that.
For a Linux or Windows box, Zabbix is much more capable. By installing the Zabbix agent on the GPU miner, the agent provides lots of basic data back to the Zabbix server, like free disk space, CPU speed, etc., and will send an alert on reboot or other problem.
The agent can also perform active check. The one I like for monitoring mining operations is log parsing. The Zabbix agent will parse a log file, looking for a regex match. On making the match, the specific information is sent to the proxy for inclusion in the GPU miner data.
Out of the box, Optiminer sends data to the screen. With a simple addition to the optiminer start command in the mining script, it also creates a log:
| tee /home/user/log/optiminer.log
I can then configure a Zabbix server template with items and triggers on that data. This is a screenshot of the Item page for GPU0 Hash Rate.

It’s string data, not integer, so I can’t create a trigger off a minimum value. And I don’t feel like converting string to integer, so I just set the trigger to alert if the log does not provide any fresh log entries within a specific amount of time. When the miner hangs, the log file doesn’t update, and I get an email alert about a problem.

I prefer an email alert so I can figure out what is wrong, then correct it. I don’t want my GPU miners constantly rebooting if at all possible. I set the problem level to High on this trigger, because I get emails about High and Disaster problems….although I actually don’t have any triggers set to Disaster.
Right now the GPU temperature is not being monitored by Zabbix. When I was using Claymore, that information was available in the log file, so I just parsed it out. Optiminer does not provide GPU temperatures, so I don’t have that information. It’s wintertime here, so I’m not worried about temperature readings just yet – I will definitely need them in the summer.
That’s ok, I can just write a script on my Linux box to use the lm-sensors application to log the GPU temperature to a file, then get and display the information the same way the GPU Hash rate is displayed. That’s on the to-do list.
Zabbix is full of all the features I need. I can set a maintenance period if I am doing work on machines so I don’t get flooded with emails. I can also set a dependency – if the network switch that my Zcash miner is connected to is unreachable by ICMP ping, then the trigger on the GPU miners won’t fire, because they are dependent on the switch being up and running.
Of course I can access the Zabbix server from my phone also:

It does not matter what monitoring system you use for your mining operations, and it helps to have one that alerts you about problems.
I like monitoring my servers, Antminers, switches, and other systems from the same flexible system. For example, this is a monitor screen of some of my Antminer S9’s. The orange is where the hash is below spec – time for a maintenance period.

If you have a monitoring system you like to use, or if you provide one, please let me know in the comments below. I am always eager to learn.


February 2, 2017 @ 9:25 am
I’m using cacti with snmp on the host.
I wrote snmp passthrough scripts, allow me to graph nice stats, like : http://tof.canardpc.com/view/ac0be9e0-a4d9-4d0a-9a5b-cb85532e9ef4.jpg
That can be pretty useful to follow trends you wouldn’t see just looking at immediate figures.
February 3, 2017 @ 8:36 am
Cacti is a great tool! Unfortunately I have not looked at it since about 2005, and I am sure it has only continued to get better.
I used to do a lot of Cisco deployments, and I built my initial monitoring tool for our Cisco support services with Cacti. The graphing is wonderful. And one can do amazing things with SNMP. I tried Nagios as well, but for some reason it seemed more server focused, and less on network gear with SNMP.
The graphing in Zabbix is very good also. I usually use it for looking at CPU and memory utilization, as well as temperatures.
July 12, 2017 @ 5:11 am
Hi Rolf, thanks a lot for the idea of using zabbix to monitor GPU temperatures. I managed to set it up and parse Claymore logs for GPU temps. But I don’t know how to get your nice table-like stats page?
All I can do now is go to “Monitoring” then “Latest data”.
July 12, 2017 @ 5:14 am
Is it “Data overview” screen? I seem found it!
July 13, 2017 @ 8:17 am
yes, that’s it. Glad you found it useful!
July 16, 2017 @ 3:12 pm
Would you possibly know how to highlight in the data overview screen if a temperature value is too high? Say over 80 degrees?
I know it’s probably also related to convert log string to numeric values..no idea how to do that either.
Many thanks
July 16, 2017 @ 3:15 pm
Should I use windows port version of awk and tail to achieve it?